Results & export
Everything you compute appears as a result card in the large area on the left. This page covers reading, customising, and getting those results out — especially into Word for a report or article.
Result cards and tabs
Each analysis produces one result card.
A card can hold several elements — tables and plots — shown as tabs you can switch between.
Results update automatically when you change a setting or an upstream data step.
Customising plots
Plots have their own controls — typically colours, axis titles, gridlines, the title/axis layout, and the figure size. Adjust these before exporting so the figure looks right in your document.
APA-style tables
Tables are formatted in APA style (clean rules, italicised statistics where appropriate), so they drop into a manuscript with minimal reformatting.
Copy everything into Word
The fastest path to a report:
File ▸ Copy All Results.
Switch to Word (or another rich-text editor) and paste.
Tables paste as real, editable tables; plots paste as embedded images. This copies all result cards at once in the order they appear.
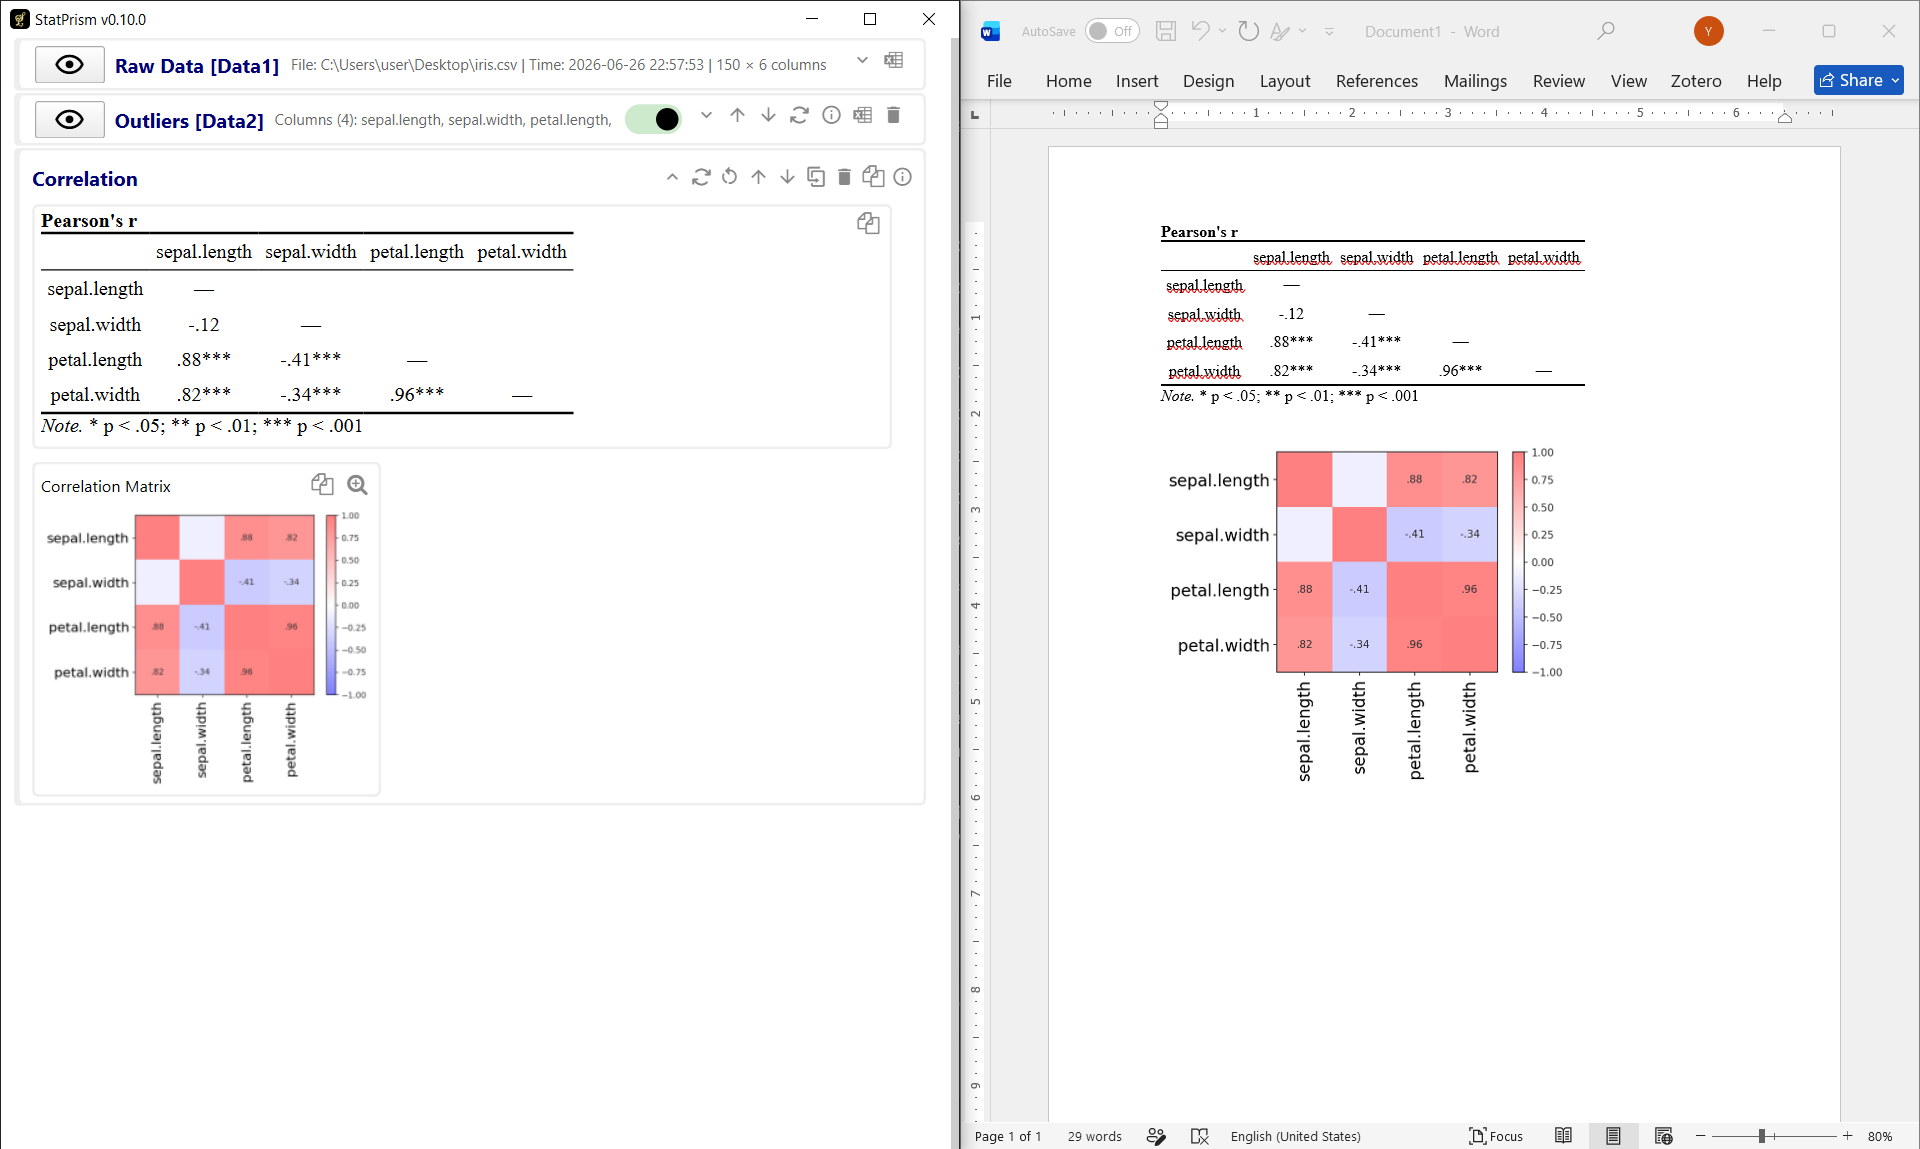
A StatPrism result (left) and the same tables and figure pasted into Word (right).
Regular paste vs. Paste Special
Regular paste (Ctrl+V) works well for most reports.
For more precise formatting, use Paste Special ▸ HTML Format.
Important
Remove the paragraph indent before pasting tables. Word applies a default first-line/left indent to body text, which distorts pasted tables (columns drift or overflow the page). Set the indent to 0 (Home ▸ Paragraph) for the area you paste into — or select the pasted tables and clear their indent — and they will line up correctly.
Tip
Set the language (Settings ▸ Language) and plot theme (Settings ▸ Plot theme) before copying — results are rendered in the current language and theme.
Export a self-contained report
File ▸ Export Report (HTML)… writes a single .html file containing every result —
tables and figures (images embedded inline). It needs no other files, so you can archive it,
email it, or open it in a browser and print to PDF. It’s also a convenient supplement to a
manuscript.
Export data to Excel
You can export the current data table to .xlsx, with each column header painted in its
colour tag — handy for sharing a cleaned dataset or for independent checking in another tool.
Resolution note
Exported plots are rendered at higher resolution than they appear on screen, so pasted and exported figures stay crisp in print.