Getting started
This page gives you a quick tour of the StatPrism window and the overall way of working.
The window at a glance
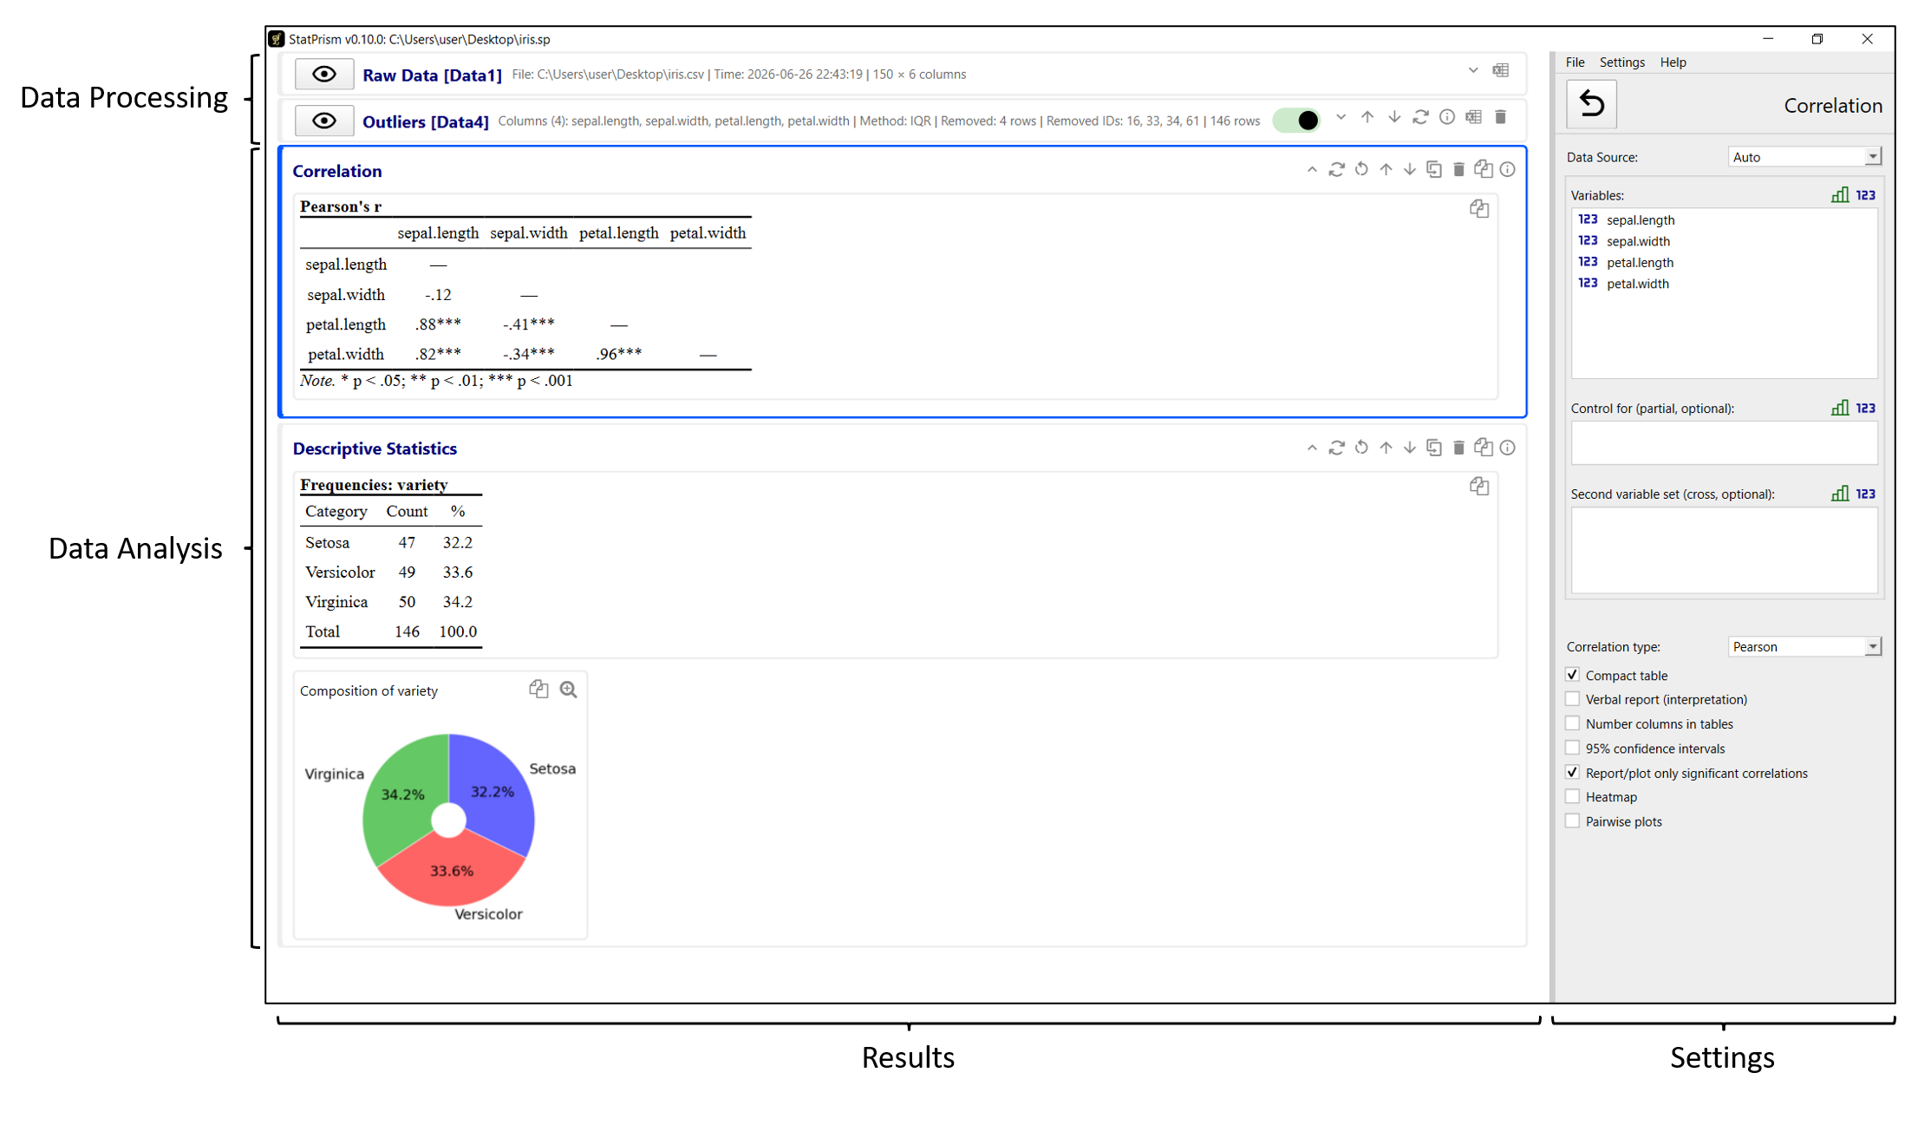
The StatPrism window: the results area on the left (one card per result), the settings panel on the right (modules and their options), and the menu bar along the top.
StatPrism has two main areas:
The panel on the right is where you do things. This narrower settings panel lists the available modules — data-processing steps and analyses — and shows the settings for whichever one you are configuring.
The large area on the left shows results — the tables and figures produced by your analyses, each in its own card.
Along the top is the menu bar with File, Settings, and Help. Language and the visual themes live under Settings.
The core idea: a chain of steps
StatPrism treats your work as a chain:
Raw data → (optional cleaning steps) → analyses
When you import a file it becomes the raw data at the start of the chain.
Each data-processing step (filter, recode, compute a scale, …) takes the data from the step before it and produces a new version. These steps stack up in order.
Each analysis reads from a data source you choose. The default source, Auto, means “the most recent data” — so analyses automatically see your latest cleaning step.
This means you can clean once and run many analyses on the cleaned data, and if you change a cleaning step everything downstream updates.
A first run in four steps
Import your data. Use File ▸ Open… and pick your survey export. See Importing data.
(Optional) Clean it. Add data-processing steps such as Filter or Impute Missing. See Preparing data.
Run an analysis. Pick an analysis module (for example Descriptive Statistics), choose the columns to analyze, and read the results on the left. See Analyzing data.
Get the output out. Use File ▸ Copy All Results and paste into Word, or File ▸ Export Report (HTML)… to save a self-contained report. See Results & export.
Choosing columns
Most modules ask you to pick one or more columns using a column selector. Selectors only offer columns of a type that makes sense for that field — for example, a grouping field accepts categorical columns, while a numeric summary accepts numeric columns. If a column you expect is missing from a selector, check its type in the data viewer (see Importing data).
Languages and themes
StatPrism is available in English and Ukrainian (Settings ▸ Language), offers several plot themes (Settings ▸ Plot theme), and has a light/dark UI theme (Settings ▸ UI theme). Changing the language or plot theme rebuilds your results to match. See Projects & settings.
Saving your work
Use File ▸ Save / Save As… to store everything — the data, every processing step,
and every analysis — in a single .sp project file you can reopen later. See
Projects & settings.
Keyboard shortcuts
Shortcut |
Action |
|---|---|
Ctrl+O |
Open a project |
Ctrl+S |
Save |
Ctrl+Shift+S |
Save As… |
Ctrl+R |
Recalculate all studies (also File ▸ Recalculate All) |
Esc |
Deselect the current study (return to the Home panel) |