StatPrism User Guide
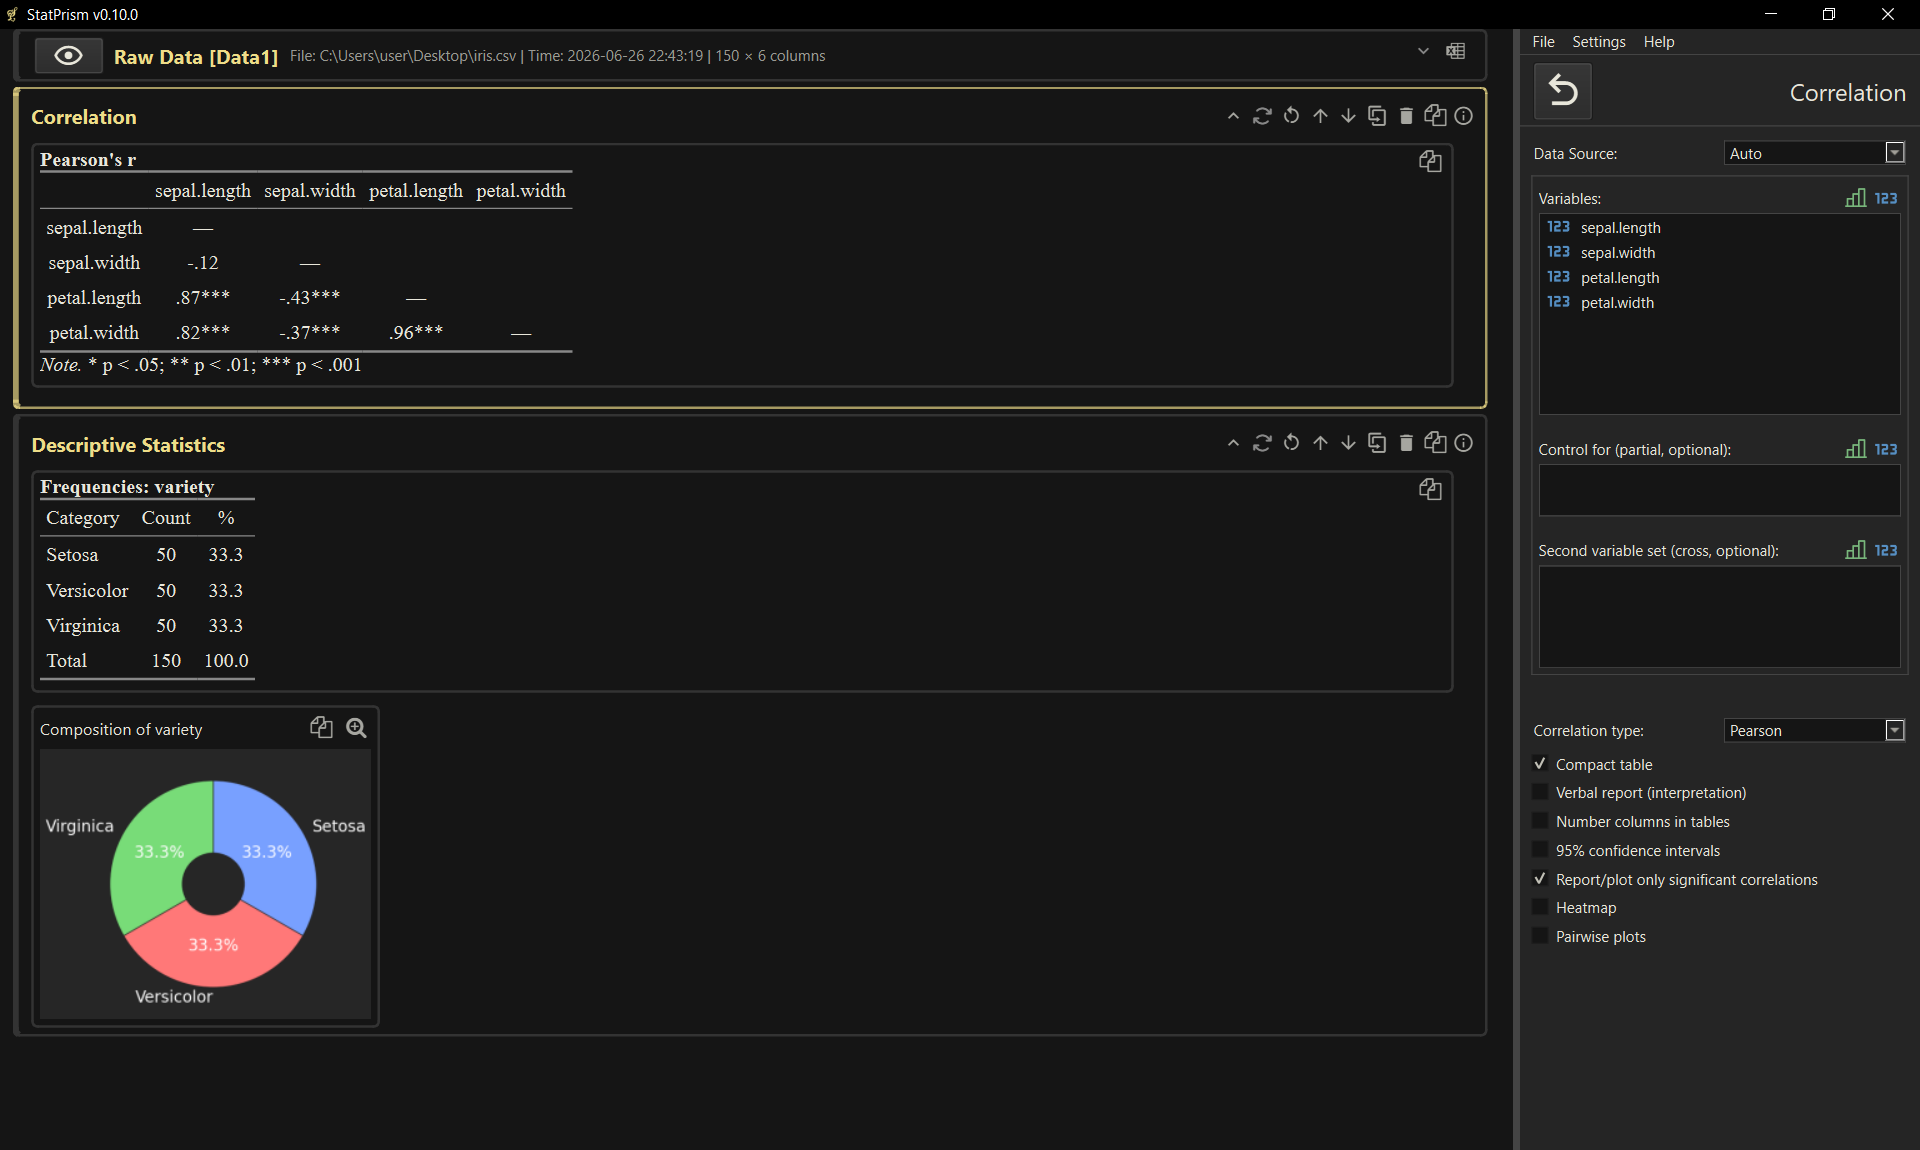
StatPrism is a desktop application for analysing survey and questionnaire data and turning it into publication-ready tables and figures. It is built for researchers and students who want correct statistics and clean, APA-style output without writing code.
Project links
Source code (GitHub): https://github.com/yakovkinii/stat_prism
Downloads & releases: https://github.com/yakovkinii/stat_prism/releases
A typical session follows one straight path:
Import a response export (for example, a Google Forms spreadsheet).
Clean and reshape the data with point-and-click processing steps.
Analyse it — descriptives, correlations, group comparisons, regression, reliability, factor analysis, and more.
Copy or export the results straight into a Word document or a report file.
This guide walks through each of those stages. If you are new, start with Getting started and then follow the Worked example: from a Google Form to a report.
Getting started
Preparing data
Analysing data
Output & projects
Reference
Note
StatPrism is open source. Found a problem or have a suggestion? Open an issue on the project’s GitHub repository.